Lab #21: Physical Pendulum Lab
Dahlia - Carlos - Luis - Bimaya
Dahlia - Carlos - Luis - Bimaya
28-Nov-2016
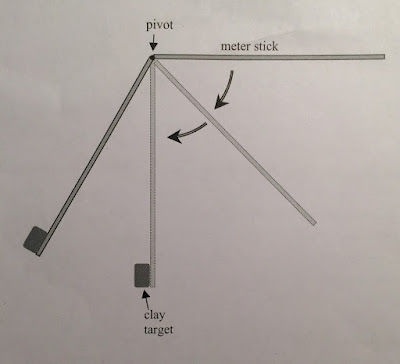
The purpose of the lab#19 is to derive an expression for the period of various physical pendulums. Then, verify the theoretical value by experiment.
In this lab, our group found periods of 3 objects: A ring, a semicircle, and a triangle.
First, we calculate the moment of inertia about the pivot and the period of the object as a physical pendulum. After that, we measured the actual period of it by connecting with Logger Pro.
And finally, we compared the experimental value vs. the theoretical result.
Part A.
Pendulum: a ring of finite thickness and a little notch cut out at the top.
1. Physical measurements of the ring:
In order to calculate the period of the ring as a physical pendulum, we needed to measure the ring's radii ( R-outer and R-inner)
This was what we had:
 Actually, in the picture, we also had the dimensions of the semicircle and the triangle as well. So, in part B and part C for the semicircle and the triangle, I do not need to show the dimensions again.
2. Derive expression for the ring:
Then, we calculated the period of the ring as a physical pendulum.
 With the dimensions we had, we plugged to the formula we just derived, and the period was 0.7155 s.
3. Measure actual period:
First, we assumed that the little notch cut out at the top was the pivot of the moment.

and the period we had was:

4. Compare the experimental result and the theoretical result.
The theoretical value: 0.7155 s
The experimental value: 0.7089 s
The percent error = (0.7155-0.7089)*100%/0.7089=0.93%
Part B.
Pendulum: An isosceles triangle of height H and base B, and a semicircular disk of radius R
Because the triangle and the semicircle did not have a hole to be a pivot, so we used some paper clips to make pivot for objects.
1. Physical measurements:
The dimensions of the semicircle and the triangle were shown before in part A
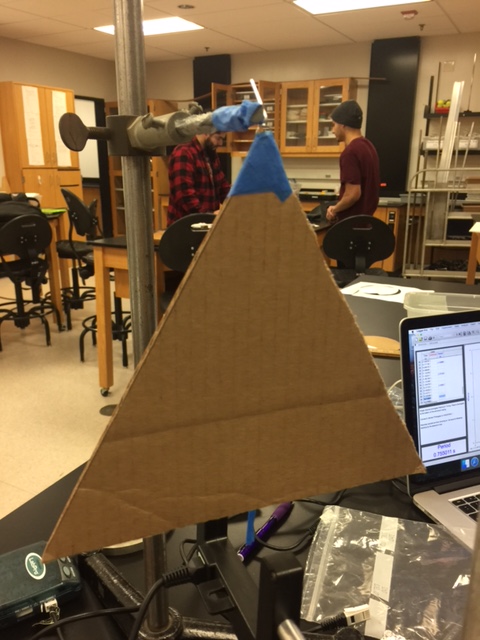
2. An Isosceles triangle, base B, height H, and oscillating about its apex:
a. Derive expression:
We calculated the period of the triangle as a physical pendulum.
 Plugged the height and the base, we had the period T = 0.764 s.
b. Measure actual period:
First, we knew that the pivot was its apex.
Then, to be able to record, we attached a thin stick note to the midpoint of its base. When oscillation took place, the photo gate could detect from the stick note.
After that, we gently tap the triangle so the oscillation occurs at a small angle displacement and collected data.

and the period we had was:

d. Compare the experimental result and the theoretical result.
The theoretical value: 0.764 s
The experimental value: 0.755 s
The percent error = (0.764-0.755)*100%/0.764=1.18%


- The semicircle oscillating about a top point on its edge: 1.71%
The error occurred because of some reasons such as the uncertainties in the measurements of the dimensions of the objects; Some frictions due to the air as well as the pivot; The paper clip made the distance a little bit higher than calculation in the theoretical result.
The extra mass of the pivot clip, located where they were should not measurably affect the period because of at the final formula, the mass was cancelled already.
In this lab, our group found periods of 3 objects: A ring, a semicircle, and a triangle.
First, we calculate the moment of inertia about the pivot and the period of the object as a physical pendulum. After that, we measured the actual period of it by connecting with Logger Pro.
And finally, we compared the experimental value vs. the theoretical result.
Part A.
Pendulum: a ring of finite thickness and a little notch cut out at the top.
1. Physical measurements of the ring:
In order to calculate the period of the ring as a physical pendulum, we needed to measure the ring's radii ( R-outer and R-inner)
This was what we had:

2. Derive expression for the ring:
Then, we calculated the period of the ring as a physical pendulum.

3. Measure actual period:
First, we assumed that the little notch cut out at the top was the pivot of the moment.
Then, to be able to record, we attached a thin stick note to the bottom of the ring. When oscillation took place, the photo gate could detect from the stick note.
After that, we opened a file named "Pendulum Timer.cmbl" to set up photo-gate to record the period of the metal ring. Finally, we gently tap the ring so the oscillation occurs at a small angle displacement and collected data.
and the period we had was:

4. Compare the experimental result and the theoretical result.
The theoretical value: 0.7155 s
The experimental value: 0.7089 s
The percent error = (0.7155-0.7089)*100%/0.7089=0.93%
Part B.
Pendulum: An isosceles triangle of height H and base B, and a semicircular disk of radius R
Because the triangle and the semicircle did not have a hole to be a pivot, so we used some paper clips to make pivot for objects.
1. Physical measurements:
The dimensions of the semicircle and the triangle were shown before in part A
2. An Isosceles triangle, base B, height H, and oscillating about its apex:
a. Derive expression:
We calculated the period of the triangle as a physical pendulum.

b. Measure actual period:
First, we knew that the pivot was its apex.
Then, to be able to record, we attached a thin stick note to the midpoint of its base. When oscillation took place, the photo gate could detect from the stick note.
After that, we gently tap the triangle so the oscillation occurs at a small angle displacement and collected data.
and the period we had was:

d. Compare the experimental result and the theoretical result.
The theoretical value: 0.764 s
The experimental value: 0.755 s
The percent error = (0.764-0.755)*100%/0.764=1.18%
3. An Isosceles triangle, base B, height H, and oscillating about the midpoint of its base:
a. Derive expression:
We calculated the period of the triangle as a physical pendulum.

Plugged the height and the base, we had the period T = 0.6828 s.
b. Measure actual period:
First, we knew that the pivot was the midpoint of its base.
Then, to be able to record, we attached a thin stick note to the apex. When oscillation took place, the photo gate could detect from the stick note.
After that, we gently tap the triangle so the oscillation occurs at a small angle displacement and collected data.

and the period we had was:

d. Compare the experimental result and the theoretical result.
The theoretical value: 0.6828 s
The experimental value: 0.6755s
The percent error = (0.6828-0.6755)*100%/0.6828=1.07%
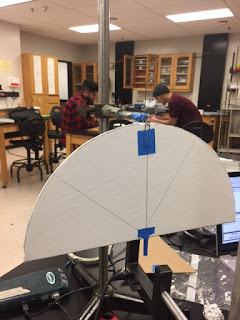
4. A semicircular plate of radius R, oscillating about the midpoint of its base
a. Derive expression:
We calculated the period of the semicircle as a physical pendulum.

Plugged the height and the base, we had the period T = 0.838 s.
b. Measure actual period:
First, we knew that the pivot was the midpoint of its base.
Then, to be able to record, we attached a thin stick note to the point on its edge, directly above the midpoint of the base. When oscillation took place, the photo gate could detect from the stick note.
After that, we gently tap the semicircle so the oscillation occurs at a small angle displacement and collected data.

and the period we had was:

d. Compare the experimental result and the theoretical result.
The theoretical value: 0.838 s
The experimental value: 0.824 s
The percent error = (0.838-0.824)*100%/0.838=1.67%
5. A semicircular plate of radius R, oscillating about the point on its edge, directly above the midpoint of the base
a. Derive expression:
We calculated the period of the semicircle as a physical pendulum.

Plugged the height and the base, we had the period T = 0.821 s.
b. Measure actual period:
First, we knew that the pivot was the point on its edge, directly above the midpoint of the base
Then, to be able to record, we attached a thin stick note to the midpoint of the base. When oscillation took place, the photo gate could detect from the stick note.
After that, we gently tap the semicircle so the oscillation occurs at a small angle displacement and collected data.

and the period we had was:

d. Compare the experimental result and the theoretical result.
The theoretical value: 0.821 s
The experimental value: 0.807 s
The percent error = (0.821-0.807)*100%/0.821=1.71%
Part C: Conclusion
Now, I listed the comparison, the percent error of each object
- The ring: 0.93%
- The triangle oscillating about its apex: 1.18%
- The triangle oscillating about the midpoint of its base: 1.07%
- The semicircle oscillating about the midpoint of its base: 1.67%- The semicircle oscillating about a top point on its edge: 1.71%
The error occurred because of some reasons such as the uncertainties in the measurements of the dimensions of the objects; Some frictions due to the air as well as the pivot; The paper clip made the distance a little bit higher than calculation in the theoretical result.
The extra mass of the pivot clip, located where they were should not measurably affect the period because of at the final formula, the mass was cancelled already.